Xdebug is an extension for PHP to assist with debugging and development. It works based on the DBGP protocol. The magic of the debugging starts when the PHP development IDE (in my case VSCode) calls the Xdebug service, and it calls back to the client establishing the two-way channel. In most cases, the configuration between the IDE and Xdebug is solved with a few tweaks of both components. I have contributed to maintaining this page with the instructions to configure Visual Studio Code for Joomla and integrate it with Xdebug: Visual Studio Code. Besides all these notes, there is always one more twist. This week, on Wednesday afternoon, all the sudden Xdebug stopped working, and none of the usual suspects was the cause. If you face a similar issue, these are my notes about the process to find out why the IDE and Xdebug stopped working.
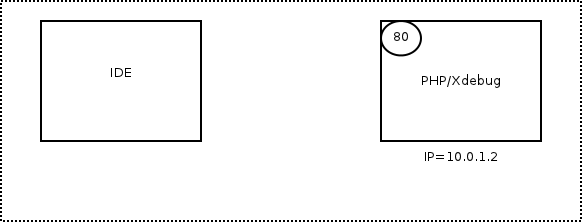
The Xdebug boot process is clearly shown in this graph:
For more details about the remote Step Debugging setup: https://xdebug.org/docs/remote
When Visual Studio Code failed to debug, I was puzzled. The usual configuration of Visual Studio Code, Xdebug, Lando / Docker and PHP was perfect.
The PHP Xdebug configuration on Visual Studio Code / extension felixfbecker.php-debug was OK.
{
    "version": "0.2.0",
    "configurations": [

        {
            "name": "Listen for XDebug",
            "type": "php",
            "request": "launch",
            // "hostname": "192.168....",
            "port": 9099,

            // server -> local
            "pathMappings": {
                "/app/www": "${workspaceRoot}/www"
            }

            // "log": false
        },
        {
            "name": "Launch currently open script",
            "type": "php",
            "request": "launch",
            "program": "${file}",
            "cwd": "${fileDirname}",
            "port": 9099
        }
    ]
}
The PHP Xdebug .ini configuration on the server has been OK since ever.
[XDebug]
xdebug.remote_enable = 1
xdebug.remote_autostart = 1
xdebug.remote_port = 9099

; xdebug.remote_log=/app/xdebug.log
; xdebug.remote_port=9099
; xdebug.remote_host = ${LANDO_HOST_IP}
; xdebug.remote_connect_back=1
But, still, the logging file showed that Xdebug received the call to start the callback connection; and it was unable to connect with the IDE.
I: Connecting to configured address/port: 192.168.....:9000.
E: Time-out connecting to client (Waited: 200 ms). :-(
What it was even weirder, it was that with telnet to the 9000, I could connect to the 9000 open port. After hours of digging and testing alternative IDEs, docker stacks, web servers; I concluded that something was wrong at the operating system level (strange, since I didn't touch the SO configuration recently).
Finally, I found this old Lando issue where they recommended to force the rule to open the port in the IPTables configuration: Xdebug can't connect to host IP (timeout)
$ sudo iptables -A INPUT -p tcp -d 0/0 -s 0/0 --dport 9000 -j ACCEPT
And... that's it. That did the trick. Xdebug started to debug correctly after the port was open.
I still trying to figure out why Linux / Ubuntu closed the port. I'll keep my eyes open to detect if or when the port is restricted again..... in any case, problem solved. I hope this recipe helps someone else if the same tough nut appears again.
To the moon!